Hedging against Disruptions with ripple Effects
I have read several articles by Mark Daskin (also reviewed another one here). So with him on the author list of today’s paper I think one can expect a clearcut research question, some kind of mathematical model, a fitting solution method and a definite answer to the underling problem. Well, let’s have a look!
Topic and method
The goal of this research is to analyze disruptions with a regional effect (as opposed to local, single facility disruptions). An example for a regional disruption may be an earthquake, storms or floods. The results should show how to better handle disruptions which are not locally limited and exhibit contagious tendencies.
The authors approach the problem by modeling three separate sub-models, namely the Defender Problem, the Attacker Problem and the User Problem.
The basic assumptions are:
- each facility has a fixed capacity,
- the capacity is affected by a disruption,
- a defense strategy can be defined for selected facilities, it protects the facilities against the disruption
Defender Problem:
“The objective of the defender is to minimize the impact of the disruption by optimally choosing Q facilities to protect. Constraints states that no partial protection of a facility is possible.”
Attacker Problem:
“The objective of this program is to strike the system as hard as possible by identifying the worst-case set of exactly R facilities chosen among those which are not protected (6).2 Finally, no partial interdiction is possible.”
User Problem:
“The user level problem deals with the minimum cost assignment of customer demands to facilities. The total cost is given by the cost for the service provided, plus the penalties paid for the demand which is not met.”
Correlation Matrix:
“The correlation matrix represents the interdependence among the facilities when an attack occurs or, in other words, the extent to which other facilities are affected when a target facility is disrupted.

Solution and Case
The authors develop a solution method, to optimize the given problem.
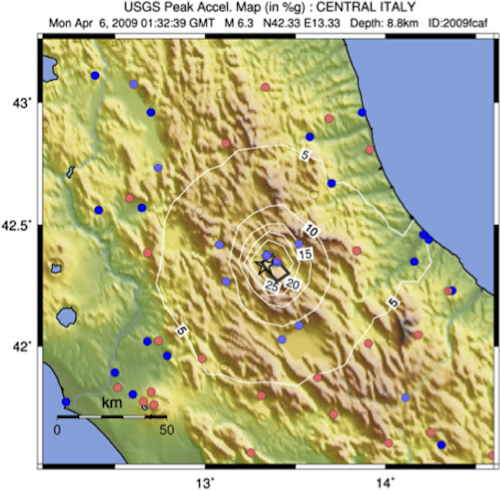
Data from the 2009 earthquake in L’Aquila, Italy was used to test the model.
Figure 1 shows a map of the area.
The dataset represents the Abruzzo region, a seismically active region of Italy, where L’Aquila is located. The set of the demand nodes, N, includes all the 305 towns and cities in the region and the associated demands, ai, correspond to the number of inhabitants as at beginning of April 2009 expressed in thousands of citizens. The set of initial facilities, F, represents the 35 hospitals of the region.
The model is solved for different parameters in two steps: first calculating the optimal defense program and second calculating the “optimal” attack, also calculating the incurred cost and correlated disruptions.
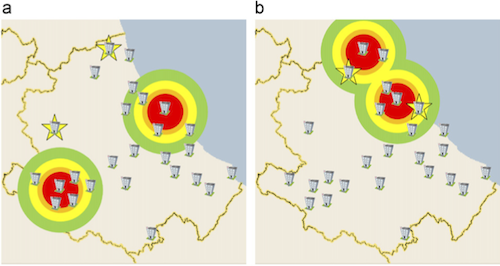
Figure 2 shows the example for two different solutions:
The buildings represent the available hospitals, stars mark the defended locations and the colored circles represent the disruption, which causes the worst effects.

Conclusion
The attacker (in this case an earthquake) always looks for the place where it can hit hardest, so the focus is on the worst case scenario: How can one fortify a system so that even in the worst case it still performs at a desired level?
But keeping that in mind also leads to the conclusion that this system might not be for everyone: What if the earthquake does not hit at the worst point? Or not at all? As a rule of thumb, I would say the investments suggested by this model are magnitudes higher than those of an “optimal” (in terms of money) solution. So when do you use such a model?
I think there are two cases: Either if one is dealing with critical infrastructure, like water, food or possibly military installations and (I know its related) if one has to decide how to safe lives: As in the case study itself, where the optimal hospital location has to be found.
Liberatore, F., Scaparra, M.P., & Daskin, M.S. (2012). Hedging against disruptions with ripple effects in location analysis Omega, 40 (1), 21-30


Add new comment