Simulation as a Tool for Supply Chain Optimization
Sometimes I am really amazed by the research topics of others. Even though I already read much about simulation and its potential benefits, up to now I have never seen a analysis of supply chain simulation performance on a larger sample. So I would like to share those insights here.
Simulation method
In this paper the authors (Manzini et al.) used a visual interactive simulation (VSI) approach for five case studies. In this case VSI refers to a simulation model that can be directly manipulated by the user of the model during simulation. So for example the effects of a change in inventory levels could be viewed directly after the fact.
This approach therefore allows for quick testing of different scenarios and possible strategies for optimization of the supply chain.
Case example
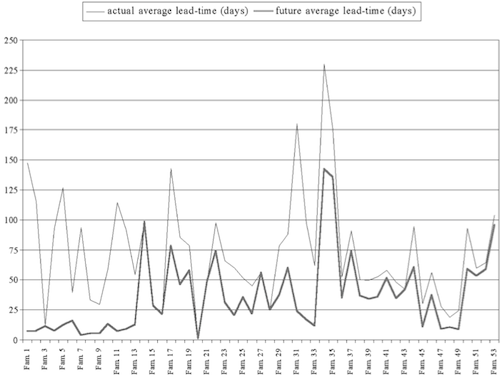
The authors elaborate five different cases where they employed the above mentioned methodology. I will just highlight one case example here: A make-to-order producer of packaging systems for the pharmaceutical industry. The produced machines consist of a large number of different components, which are supplied by external suppliers. The authors build a model containing the 18 major suppliers, which supply overall 53 modules for the final product.

Based on the simulation model different measures have been developed to reduce lead times from the suppliers. Figure 1 shows the effects of those measures for each of the 53 components. The lead times could be reduced in nearly all areas.
Case analysis
As in any multi-case study after the description of the different examples a cross case analysis and synthesis is necessary to compare the results and draw further conclusions. In this case the author calculate five indicators for each case study which describes the effort for the simulation study and the resulting benefits:
- General indicators of model complexity:
- NE index is the number of entities used in the simulative model so as to describe the real situations that can occur; and
- PT takes into account the programming time in terms of man-hours dedicated by the programmer to develop the model.
- General indicators of model effectiveness:
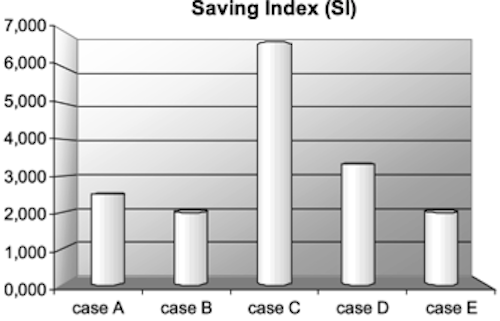
- SI is the saving index, defined as the ratio between savings forecast and costs of simulation approach; this is introduced to show the economic feasibility of the simulative model;
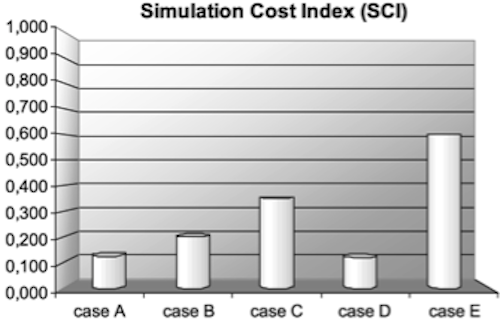
- SCI, simulation costs index, is the ratio between simulation costs and plant modification costs required for the supply chain optimisation so it deals with the simulation’s economic weight in a complete project; and
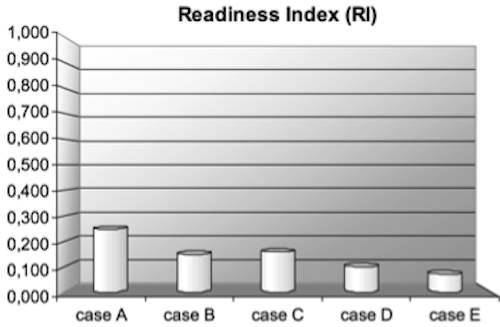
- RI, readiness index, is the ratio between the lead-time of the simulative approach and real project time extension; it measures the capability of the dynamic model to give rapid solutions to a problem.
Result
The above mentioned indices are then used to compare the different case studies concerning the effective and efficient use of the VSI simulation method within each of the settings.
Figure 2 shows the savings index of the companies which compares the savings the company could achieve using the selected measures versus the cost of the simulation (more is better).

Figure 3 shows the simulation cost index which refers to the cost of simulation versus the overall project costs for implementing the measures within the respective supply chain (less is better)

Figure 4 displays the readiness index. This describes the amount of time it took to execute the simulation versus the total project time necessary to make the changes (less is better).

The authors conclude based on these results that the VSI method is very suited for deployment in a business setting.
Conclusion
The authors make a strong case for “their” simulation approach: visual interactive simulation and claim that it is especially useful from a cost / benefit point of view. Also the results in the cases are delivered quickly.
I would love to see another comparison including other simulation approaches, since at least from a theoretical point of view, the VSI is a very simplistic simulation method. There is no optimization selecting the best strategy from several alternatives, but the simulation modeler has to select and evaluate the “best” strategy by himself.
Nonetheless a simple approach has advantages from the complexity perspective. As always: Case studies are not representative, but should give a hint for further research, so go ahead and do some research!
Manzini, R., Ferrari, E., Gamberi, M., Persona, A., & Regattieri, A. (2005). Simulation performance in the optimisation of the supply chain Journal of Manufacturing Technology Management, 16 (2), 127-144 DOI: 10.1108/17410380510576796


Add new comment