Supplier Risk Monitoring for the Automotive Industry
A typical supply chain risk management process consists of four steps: risk identification, assessment, management and monitoring. From those steps, one of the most neglected step is the risk monitoring.
Risk monitoring implies two different actions: Continuous risk assessment and actions, as soon as pre-defined limits are reached.
So this article sheds light on the risk monitoring, from an article by Blackhurst, Scheibe and Johnson (“Supplier risk assessment and monitoring for the automotive industry”).
Literature
After the analysis of the current literature the authors come to the conclusion: “Of the two methodologies we did find to monitor risks, neither addresses measuring, assessing and monitoring supplier risk over time. In addition, research that has examined supplier evaluation models has indicated that most methods are too mathematically complex to implement and understand, require excessive amounts of data, or are too subjective.”
So the authors want to close this gap, by developing a risk assessment and monitoring methodology for a US automotive manufacturer.
Risk assessment and monitoring methodology
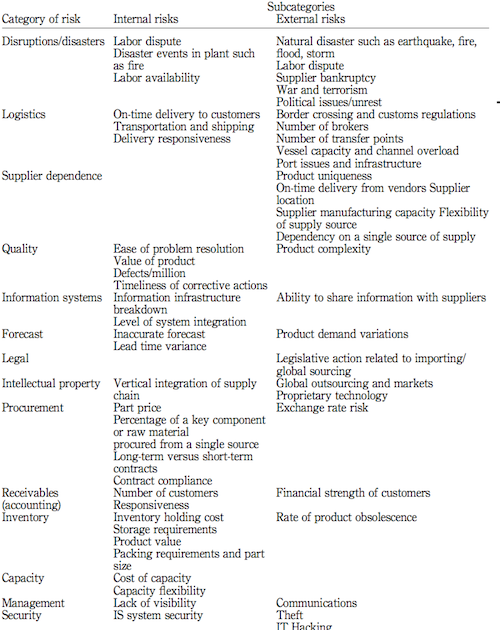
Core of the risk monitoring methodology is the risk assessment, which is done using several categories of risk. The authors extend the framework of Chopra and Sodhi (2004), which contains nine risk categories: disruptions, delays, systems, forecast, intellectual property, procurement, receivables, inventory, and capacity.
To adapt this framework to the specific needs of the automotive industry.
For example, in the Chopra and Sodhi framework there was a risk category called delays. While this is a reasonable category in general terms to describe delays in material flows, it is insufficient to capture the necessary detail of risk elicited through our interviews with the auto manufacturer. Consequently, we expanded delays into logistics, supplier dependence, and quality.
Figure 1 shows the selected risk categories divided into internal (controllable) and external (uncontrollable) risks.

Each of these categories are then weighed, so that the sum of all weights adds up to 100%. The subcategories also have to be weighed to show their relative importance within the risk category. In the example of the automotive manufacturer the focus was on quality and disruptions only, with 40 and 60 percent respectively.
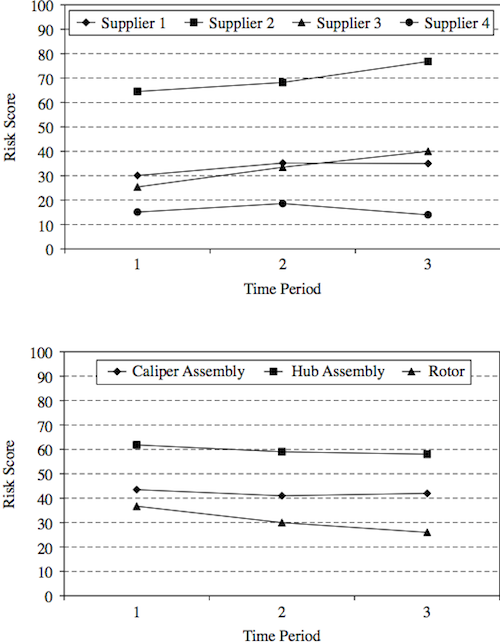
Using the example of a disc brake assembly, the next step is to assess the risks of the individual parts of the supply chain product. In this case: caliper, hub and rotor. The results are shown in figure 2 and aggregated in a heat map (figure 3).
The results can also be interpreted towards the individual suppliers (figure 4).
Continuous process
The authors elaborate extensively on the requirements of a risk assessment and monitoring methodology:
Any risk assessment methodology should be able to develop a list of rank ordered critical parts (whether pre-specified or determined by the assessment tool); with critical risk parts at the top and low-risk parts at the bottom.
Furthermore the main purpose of an implementation of a risk monitoring is to switch from a reactive supply chain risk management to a continuous and proactive one.
To do this, risk ratings and/or risk indices must be tracked over time and trends monitored to determine if they are reaching unacceptable levels.
For this the risk scores developed above have to be updated regularly and can lead to a time dependent analysis shown in figure 6.

Operational issues
The authors see four operational issues:
- The number of categories and subcategories used becomes a balancing act. As more subcategories are added to a particular category, the relative impact each subcategory has on the score of the overall category declines. Similarly, as more categories are added to the risk assessment and monitoring tool, the relative weight each category contributes to the overall risk index of a supplier or part declines.
- A higher weight on a particular factor will cause that factor to have more impact on the calculated risk index. As previously mentioned, the weights can be based on the probability of each category of disruption occurring, the relative impact each category of disruption has on supply, or any other factor considered important to the company.
- Each subcategory must be rated. Some factors such as war and terrorism, political issues/unrest, information infrastructure breakdown, level of system integration, etc. are quite subjective and ratings on these factors should be made by higher level managers familiar with assessing these factors.
- In order to use the methodology in a proactive manner, the ratings on each subcategory must be updated on a periodic basis and the data analyzed for patterns, high-risk levels, or trends that indicate potential problems. […] Therefore, the time interval between updates will also vary from subcategory to subcategory.
Conclusion
Overall the automobile manufacturer from the case study was reportedly very pleased with the resulting process and its relative ease of use and implementation: “it is too early to use overly sophisticated and brittle methods. We need an easily employable and understandable method such as this.”
I think the authors not only did a good job in summarizing the process, but also reflecting on its implications and shortcomings.
Blackhurst, J., Scheibe, K., & Johnson, D. (2008). Supplier risk assessment and monitoring for the automotive industry International Journal of Physical Distribution & Logistics Management, 38 (2), 143-165 DOI: 10.1108/09600030810861215


Comments
Great common sense here. Wish I'd thouhgt of that.
Add new comment