Supply Chain Redesign for Resilience using Simulation
Today we have a look at current research regarding the improvement of resilience within a supply chain.
In their 2012 paper “Supply chain redesign for resilience using simulation” Carvalho et al. analyze supply chain resilience on the basis off a Portuguese automotive parts manufacturer.
Methodology
As indicated by the paper’s title the authors main method is a simulation study. The simulation model is based on the results of a case study. Semistructured interviews were conducted to gather the relevant data off a Portuguese automotive supply chain.
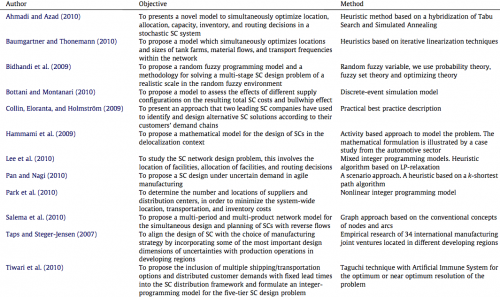
But first, the authors analyze the current literature on supply chain design and resilience (figure 1).

Figure 1: Literature Review Supply Chain Design (Carvalho et al., 2012)
Simulation model
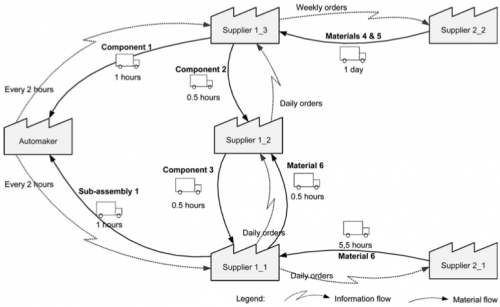
The structure of the supply chain model is shown in figure 2. The Portuguese automaker has a capacity of over 180,000 vehicles per year and all vehicles are customized.
Figure 2: Supply Chain Structure (Carvalho et al., 2012)
Arena 9.0 in conjunction with Microsoft Excel has been used to implement the model of the supply chain.
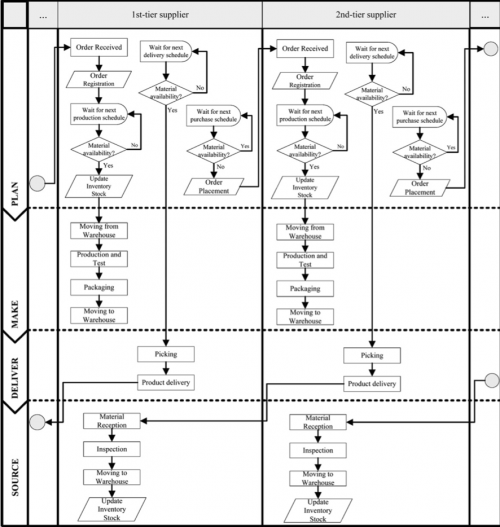
The processes which have been identified rely on the SCOR process definitions. Figure 3 shows the simulation model flowchart.

Figure 3: Supply Chain Processes (Carvalho et al., 2012)
Supplier lead-times were estimated together with the case study participants using triangular distributions (figure 4).

Figure 4: Input Data Lead Times between Suppliers (Carvalho et al., 2012)
Performance was measured using two key performance indicators: lead-time and total cost.
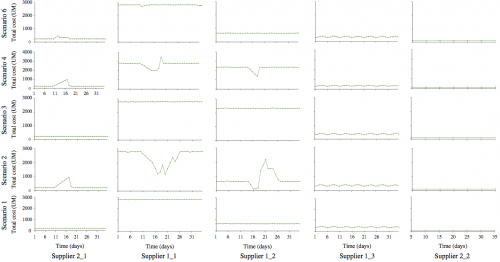
Overall six scenarios were designed by the authors. One containing the base scenario without using any strategy to reduce risk, one using a redundancy-strategy, and another one implementing a flexibility-strategy. These scenarios were then duplicated to generate one group with a disruption in the material flow between supplier 2_1 and 1_1 and another group without any disruption.
Figure 5 shows the total cost performance in different scenarios. Scenarios to 4 and 6 are affected by the disruption.

Figure 5: Simulation Results in different Scenarios (Total Cost, Carvalho et al., 2012)
The authors conclude
Two strategies widely used to mitigate disturbance ad- verse effects on SCs were considered (flexibility and redundancy) and six scenarios were designed. To evaluate the different scenar- ios designed, two performance measures were defined and com- puted for each SC entity, Lead Time Ratio and Total Cost.
The results of the simulation allowed to compare SC behavior after the occurrence of the disturbance under the two SC resilience design strategies. Both strategies are effective in reducing the neg- ative effects of the disturbance on SC performance. When the flexibility strategy is applied the Total Cost of the SC is less, in comparison with the redundancy strategy and the Lead Time Ratio is better.
Conclusion
Since my own research revolved in parts around my own simulation model I have two comments on this specific implementation, but I would like to share with you:
- I’ve seen this already in other papers: the description of the scenarios is really bad. For one there is no overview summarizing the key differences between each of these scenarios, furthermore the description of how these scenarios are implemented in the supply chain model lack in detail.
- Another key aspect to simulation modeling is the validation off the model’s output. In this case the authors are using real input data from the case study, but there is no mention if they also compared the model’s output with the real supply chain.
The conclusion of the authors also highlights the difficulty of interpreting simulation results. What could one learn from this study? Redundancy and flexibility can be used to reduce risk?
For me this insight does not qualify as a groundbreaking revelation. At least not in 2012.
Carvalho, H., Barroso, A.P., Machado, V.H., Azevedo, S., & Cruz-Machado, V. (2012). Supply chain redesign for resilience using simulation Computers & Industrial Engineering, 62, 329-341 DOI: 10.1016/j.cie.2011.10.003


Add new comment