Assessing Vulnerability of a Supply Chain
At this year’s HICL conference in Hamburg, I was able to present some of my own research. In the follow-up discussions several points were highlighted, especially focussing on the viability of supply chain wide cooperation and collaboration efforts and on the difficulties of doing a realistic quantification of supply chain risks.
I already read a great paper on this topic some time ago: “Assessing the vulnerability of supply chains using graph theory” by Stephan M. Wagner and Nikrouz Neshat (2010), which I present you today.
Disruptions and vulnerabilities
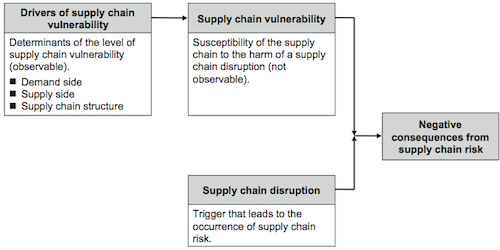
Several authors argue that several factors help increase the vulnerabilities of today’s supply chains. When supply chain complexity increases (e.g. supply chain length, higher division of labor, …), the vulnerabilities also rise. Furthermore there is evidence that natural and man-made disasters are on the rise as well (figure 1).
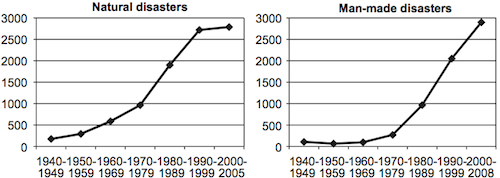
So, since natural- and man-made-disaster most often cannot be influenced directly, the authors argue that the focus has to be on reducing the vulnerabilities themselves.
Assessment of vulnerabilities
Wagner and Neshat suggest a four step algorithm based on graph theory, which is used to calculate a Supply Chain Vulnerability Index (SCVI). The algorithm is based on graph theory (which has been part of another study here). Key to the understanding of the SCVI is the risk driver mentioned above. Figure 3 shows an abstract example with three vulnerability drivers (D1 to D3) and their links.
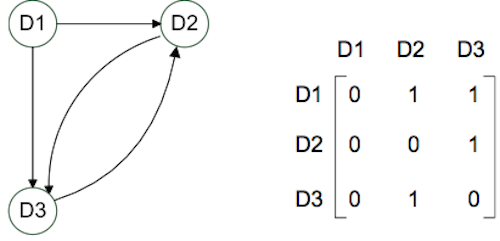
To calculate the SCVI the supply chain risk manager has to create a map / graph of the current risk drivers (step 1), find the corresponding relations between the risk drivers (step 2), calculate the “influence matrix” (step 3) and deduce the SCVI. As a forth step SCVIs of different companies can be compared to gain further insights for optimization and risk reduction.
Figure 4 shows the main drivers of supply chain vulnerability.
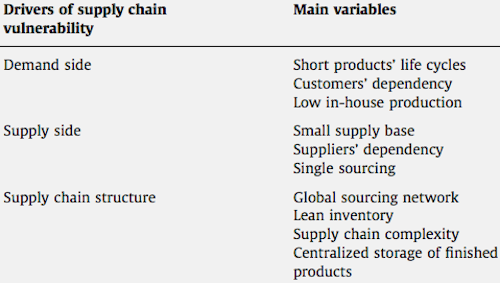
Using graph theory makes it possible for the risk manager to get an overview of the influencing factors of supply chain risks. It also enables him to act on this knowledge. Figure 5 shows a possible simplification / vulnerability reduction.
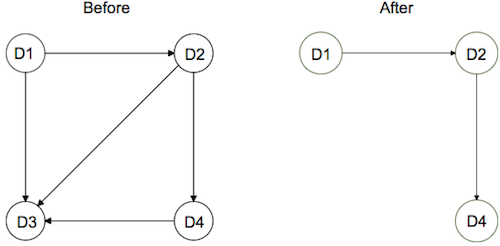
D3 in figure 5 “is called a ‘sink’ – which means that D3 can only be influenced by three other drivers and cannot influence others. Considering the graph nodes and edges, supply chain managers can apply risk management methods and implement mitigation strategies to omit or alleviate some of the vulnerability drivers. Figure 5 shows the graph after D3 has been omitted. As one can see, the resulting graph contains less vulnerability than it did prior to implementing the measures.”
Empirical data for the SCVI
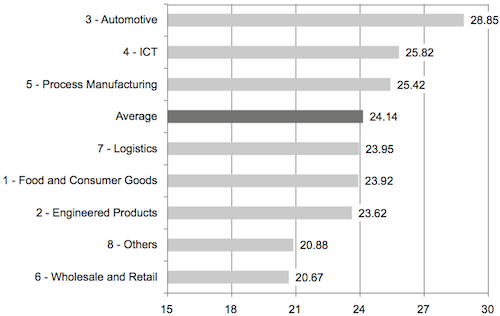
The authors also conduct a survey with over 700 participants from different industries. Based on their feedback the authors assess the Supply Chain Vulnerability Index for eight different industries. The results are summarized in figure 5. And give support to the hypothesis that the automotive industry has one of the highest risk levels.
Conclusion
I really like the graph approach to assessing supply chain vulnerabilities. And I think it is a great method to support the understanding of a complex system like the supply chain. The article combines two very interesting aspects of it: the practical implementation and the assessment of supply chain vulnerability and a survey to compare different vulnerability levels across industries. The complete article, where you find more details on the survey results and the algorithm for calculating the index, can be downloaded here.
From a business and research point of view this article should direct the supply chain risk management efforts especially in the industries with the highest risk levels, Automotive and ICT.
Wagner, S.M., & Neshat, N. (2010). Assessing the vulnerability of supply chains using graph theory International Journal of Production Economics, 126, 121-129


Comments
thank you
You're welcome!
Add new comment