Improving Performance in Food Supply Chains by Reducing Uncertainty
Today’s article is from the late 90s, but sets a great example for research methodology in supply chain risk management. But don’t worry, I will focus on the results, since they’re very interesting as well. The objective of today’s article (Supply Chain Management in Food Chains: Improving Performance by Reducing Uncertainty) is to show strategies (here called principles) to reduce uncertainty, and at the same time show the beneficial effects of reduced uncertainty.
Methods
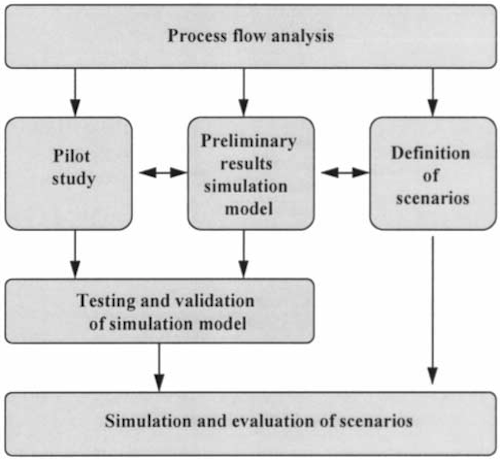
Three methods were deployed to ensure the validity of the results. Based on a case study (1) of a chilled salads supply chain sources of uncertainty were generated and improvement principles designed. The analysis of the case study’s processes was also used to feed into a simulation model (2) of the supply chain, which was validated using (another) pilot study (3).
The approach is shown in figure 1 and is meant to ensure that the results presented below are worth reading.

Results case studies
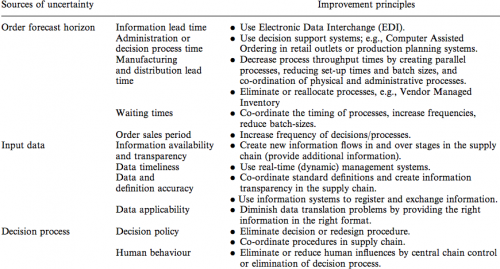
The sources of uncertainty, which were uncovered during the process analysis in the first case study, can be found in figure 2.
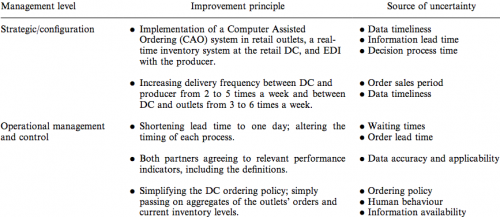
For the pilot study not all of the above mentioned improvement principles have been employed. The authors evaluated the following strategies (figure 3).
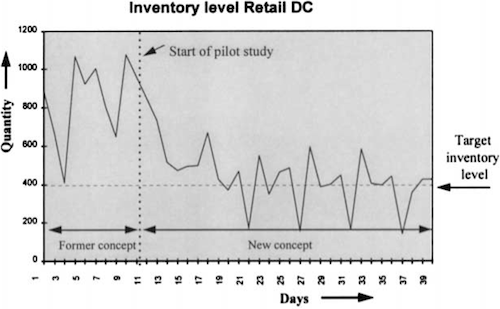
By implementing them a very drastic decrease in inventory levels could be achieved (examples see figure 4). Overall results can be found in figure 5.

Results simulation
The results of the pilot study were then compared to the simulation model. Overall there seems to be a good fit between the model and the real data (figure 6).
Further results were generated using the simulation model:
- For fast moving goods optimization could be achieved by increasing the delivery frequency both to the retailer and to the DC by a certain amount. Even though the picking cost rose, inventory levels could be decreased significantly.
- Implementation of a computer aided ordering system lead to an improvement of supply chain performance between 10 and 20%.
Conclusion
For the authors the simulation model is a logical extension of the prior case studies. Using it makes it possible also to test alternatives which in reality might be too expensive or even impossible to test.
Another key lesson: Reduction of uncertainties again is a major driver of supply chain performance and therefore should not be neglected.


Add new comment