Solution to Strategic Supply Chain Mapping
I just realized that my favorite book on crafting diagrams to better communicate in a graphical way (Envisioning Information) just has been turned into a paper on mapping supply chains.
So I am happy to summarize an article, which focusses on how to convey complex information in an concise and comprehensive way.
Supply chain mapping
I already wrote about this topic several times. But because this is a very important issue, I did not hesitate to do it again from a different angle.
There are several key advantages to supply chain mapping:
- To link corporate strategy to supply chain strategy.
- To catalog and distribute key information for survival in a dynamic environment (in order) to direct the focus of the managers.
- To offer a basis for supply chain redesign or modification.
- Current channel dynamics can be displayed in a supply chain map.
- The process of building the strategic supply chain map, in itself, will help define the perspective of the supply chain integration effort.
- continued in the article
However there are obstacles preventing an effective supply chain mapping. One is, as often, the complexity of the supply chain.
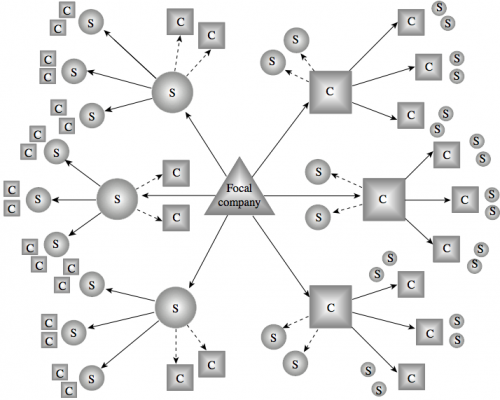
Even with only a few echelons in focus the number of entities and connections just explodes. Figure 1 shows the results of some simple calculation. A supply chain with five tiers and only two connections per tier already contains 13 chain elements.
Figure 1: Number of Entities in a Supply Chain Map (Farris, 2010)
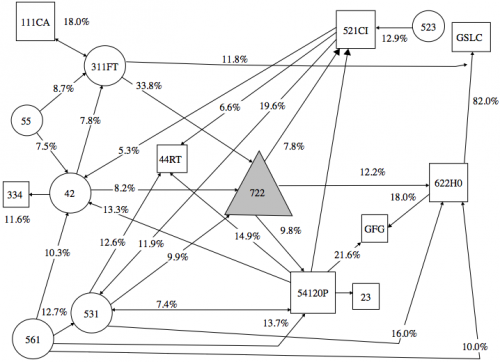
So in no time a supply chain map looks like the one in figure 2 or 3.
Figure 2: Complexity of a “short” Supply Chain (Farris, 2010)
Figure 3: Bad Example for the Representation of Material Flow (Farris, 2010)
Issues in supply chain mapping
Four issues in supply chain mapping can be recognized.
[…] Four issues [were identified] which must be addressed to further the development of strategic supply chain mapping:
- proprietary information;
- inadvertently changing channel dynamics;
- getting lost in too many details; and
- providing an ineffective perspective for management use.
Recommended supply chain mapping
Over a five year period the author conducted several “classroom laboratories” with his students doing experiments on how to improve current mapping techniques.
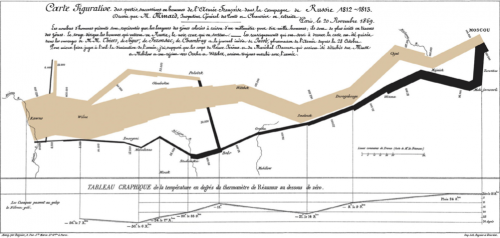
This is where the above mentioned book comes into play. In it you find a picture of probably the oldest geo-visualization (figure 4). In this case it was used to describe the declining strength (measured in number of soldiers) of Napoleon’s invasion of Russia and the way back. Highlighting the fact that most soldiers did not die in battle, but on their way to and from Moskow.
Figure 4: First Geovisual Map (click to zoom; by Minard, 1844-1870; Farris, 2010)
While this also highlights the importance of a good supply chain. Focus in this case is on the massive amount of information which can be extracted from this diagram (strategies, movement, location, time, strength), while still keeping a relatively low size and low perceived complexity.
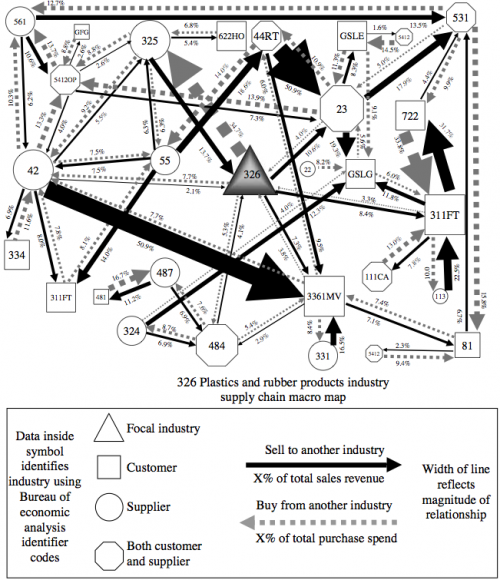
Based on this idea and other insights, several iterations with the students lead to several key learnings and a recommended supply chain map. Figure 5 shows the recommended map, displaying the supply chain interactions on an industry- (not company!) level.
Figure 5: Example of a Recommended Supply Chain Map (Farris, 2010)
Lessons learned:
- Utilize geovisualization techniques
The mapping efforts utilized a geovisual technique combining weighted solid and dashed arrows and lines, defined symbology representing different trading relationships, and the representation of financial flow to develop maps rich in content.
- Start at a higher level
It is highly unlikely a company would be able to, or would desire to, expend the resources required to map 100 per cent of all of their customers and suppliers. Each mapping effort must determine the economic trade-off between the level of detail of their map, the cost to gather the detail, and the benefit received. […] Owing to the ready access to economic data, an industry macro map may offer the greatest mapping value for a relatively minimal investment. It is recommended that the map designer begin at a high level and then drill down.
- Strive to keep the maps strategic
[…] strategic supply chain maps must maintain a strategic emphasis, any users with a desire to drill down to an operational level should utilize alternative process-related tools such as the SCOR model […]. Keep the strategic supply chain maps at a high, strategic level and avoid undue complexity.
- Manage a synergistic network
As value chain mapping continues to evolve, map designers may find that the term “supply chain” is a misnomer. Strategic supply chain maps quickly reflect a “supply network” as it is not unlikely that a customer’s customer may be a critical supplier’s supplier. Recognition of these types of relationships may have far-reaching strategic impact in terms of keiretsu-type relationships or jointly beneficial marketing efforts […].
- Embrace mapping creativity
[…] it was determined there was no single approach to developing a strategic supply chain map. Creating a strategic supply chain map is as much an artistic endeavor as it is a defined process. […] It is recommended that firms attempting to strategically map their supply chain embrace this fact by asking multiple individuals who create a map to use the same data set. Each variation may result in components within the map which offer easier readability and should be incorporated into the final map.
Conclusion
The resulting supply chain map is overwhelming at first, but which map wouldn’t be. A complex system like a supply chain and its supporting parameters are just hard to zip onto a single page.
After a short while of looking at the map I was just amazed how much information could be deduced from it.
I think using the lessons learned and (not too many) different information layers in a map can result in highly aggregated and informative results, ergo in a real supply chain map.
Faris II, M.T. (2010). Solutions to strategic supply chain mapping issues International Journal of Physical Distribution & Logistics Management, 40 (3), 164-180 DOI: 10.1108/09600031011035074


Comments
Thanks
If you like this article, you can rate it, using the star-system above. Articles that are rated higher are more likely to show up on the front page.
Daniel
I really like the Minard map, and Figure 5 is fine for an industrie level. But if you use this on an company level, it might become too complex (from my point of view ).
An idea to avoid complexity in supply chain mapping: Use a database with companies (nodes) and relations (edges). Attach attributes to nodes and edges. Then use filters to extract the data and display the map automatically (be using a graph algorithm). This is the way we do it.
Add new comment