Uncertainty in Value Stream Mapping Analysis
Supply chain mapping can be a great tool to foster the understanding and from its results improve a supply chain network overall. Supply chain mapping can also be used to analyze the risks of a supply chain and improve its resilience (for an example in the blog follow this link).
A SC mapping can also lead to implications for risk management, but how do you include existing information about the risks themselves in the analysis?
Braglia et al. (2009) analyze this problem and suggest two approaches to include variability in a value stream mapping (VSM) with the goal of better identification of the wastes in a single plant setting, but I think their insights might also be interesting for a supply chain setting.
Method
Value stream mapping can be described as “a graphical representation of both materials and information flow within a facility”. This permits to analyze the process and make calculations, e.g. regarding the total production lead time (TPLT), the total value-added time (TVAT) and the efficiency of the process (η = TVAT/TPLT)
VSM is not the method of choice for all problems, beside some pros there are also the cons:
Pro
- It shows the linkage between product flow and information flow;
- it includes information related to production time as well as to inventory levels;
- it helps to visualise the production process at the plant level, not just at the single process level.
The main cons include
- it is a paper- and pencil-based technique, thus the accuracy level is limited and the number of versions that can be handled is low;
- it lacks the spatial structure of the facility layout and how that impacts interoperation material handling delays;
- it cannot address the complexity of high-variety low-volume type companies, whose value streams are composed of hundreds of industrial parts and products.
Uncertainty and VSM
The authors suggest two similar approaches to include uncertainty within the VSM: the stochastic and the fuzzy approach.
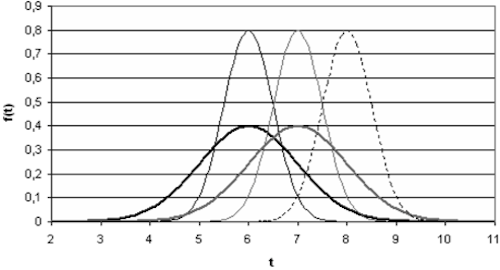
In the stochastic approach uncertainty is described using distribution function (figure 1) with a mean and standard deviation.

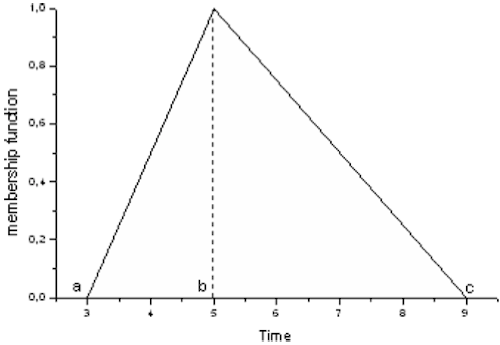
In the case of a fuzzy logic the uncertainty is described using a triangle function (figure 2), which can be described by the start and end values (a and c) and the maximum b.

Application
When applying one of the mapping approaches the authors suggest to follow the following seven step process:
- The analysis starts with the identification of the value stream (i.e. product family) that has to be mapped.
- Walking backward in the process (i.e. from the finished good inventory to the raw materials warehouse), practitioners collect all the relevant data and draw a sketch of the actual state map.
- [To include the random aspects of the value stream,] the waiting/processing time of each activity is approximated [and represented by a corresponding function.
- The actual state map is completed substituting, in the corresponding process boxes and on the timeline, deterministic times with the random variables.
- [The TPLTs are calculated using stochastic methods]
- Using lean principles possible future state maps are designed and their expected TPLT is evaluated […]
- Obtained improvements are evaluated comparing the TPLT.
The major milestones in the process are therefore the completion of the map of the actual state and possible future state maps.
Figure 3 shows the actual state map for a case study company presented in the article. Underneath the map you find the process times with deterministic values, stochastic representation and fuzzy representation of the uncertainty (from top to bottom, click on the image to show a larger version).
One example for a possible future state of the supply chain is shown in figure 4, again with the respective lead times.
Conclusion
Value stream mapping can be used in a supply chain setting as well. And it can help to find bottle-necks – and as shown here the randomness of processes can be included as well. The authors make a great job of explaining the mentioned approaches and sketching the implementation as well.
Sadly, they forgot to describe the advantages of the inclusion of randomness in the value stream mapping: After presenting a second future state the authors do a statistical comparison of the two outcome distributions and conclude: “Therefore both methodologies show that the first solution is definitely better than the second one.”
But, if they had just compared the deterministic process times they would have come to the same conclusion! So where is the point in including the randomness at all?
Braglia, M., Frosolini, M., & Zammori, F. (2009). Uncertainty in value stream mapping analysis International Journal of Logistics Research and Applications, 12 (6), 435-453 DOI: 10.1080/13675560802601559


Add new comment